# The usual imports
import altair as alt
import geopandas as gpd
import numpy as np
import pandas as pd
from matplotlib import pyplot as plt
# Show all columns in dataframes
pd.options.display.max_columns = 999
# Hide warnings due to issue in shapely package
# See: https://github.com/shapely/shapely/issues/1345
np.seterr(invalid="ignore");
import osmnx as ox
NYC = gpd.read_file("new-york-city-boroughs.geojson")
NYC_M = NYC[NYC["name"] == "Manhattan"]
NYC_MI. Network Analysis
Part 1: Street Network with OSMnx
1. Load the geometry for the region being analyzed
In this section, we wish to examine the crash data through street network on Manhattan to explore spatial patterns of crashes in certain area that might cause by congestions. We used the Motor Vehicle Collisions data from NYC Open data. Each row of the data contains one crash event, with information like location, time, causes, types of vehicles etc. We filtered the time from May 2021 to Dec 2023, in accordance with the date for traffic data in machine learning section.
2. Get the street network graph
# Project it to Web Mercator first and plot
ax = NYC_M.to_crs(epsg=4326).plot(facecolor="none", edgecolor="black")
ax.set_axis_off()
3. Convert your network graph edges to a GeoDataFrame
# Define your polygon boundary (replace with your actual polygon)
# For example, if you have a GeoDataFrame with your area boundary:
polygon = NYC_M.unary_union
# Create a street network graph
G = ox.graph_from_polygon(polygon, network_type='drive')
# Convert graph edges to a GeoDataFrame
edges_gdf = ox.graph_to_gdfs(G, nodes=False, edges=True)
# Display the first few rows of the GeoDataFrame
print(edges_gdf.head())
# Plot the edges GeoDataFrame
fig, ax = plt.subplots(figsize=(20, 20))
edges_gdf.plot(ax=ax, linewidth=1, edgecolor='black')
plt.show() osmid name \
u v key
42421728 42435337 0 195743153 Central Park West
42421731 0 [420625565, 420625573, 5668966] West 106th Street
42432736 0 [1271523197, 1271523198] Central Park West
42421731 42437916 0 5671485 Manhattan Avenue
42432737 0 195743186 Manhattan Avenue
highway maxspeed oneway reversed length \
u v key
42421728 42435337 0 secondary 25 mph False True 85.345
42421731 0 secondary NaN False False 138.033
42432736 0 secondary 25 mph False False 86.275
42421731 42437916 0 residential NaN False True 86.149
42432737 0 residential NaN False False 85.968
geometry \
u v key
42421728 42435337 0 LINESTRING (-73.96004 40.79805, -73.96011 40.7...
42421731 0 LINESTRING (-73.96004 40.79805, -73.96017 40.7...
42432736 0 LINESTRING (-73.96004 40.79805, -73.95997 40.7...
42421731 42437916 0 LINESTRING (-73.96147 40.79865, -73.96154 40.7...
42432737 0 LINESTRING (-73.96147 40.79865, -73.96140 40.7...
lanes ref access bridge tunnel width junction
u v key
42421728 42435337 0 NaN NaN NaN NaN NaN NaN NaN
42421731 0 NaN NaN NaN NaN NaN NaN NaN
42432736 0 NaN NaN NaN NaN NaN NaN NaN
42421731 42437916 0 NaN NaN NaN NaN NaN NaN NaN
42432737 0 NaN NaN NaN NaN NaN NaN NaN 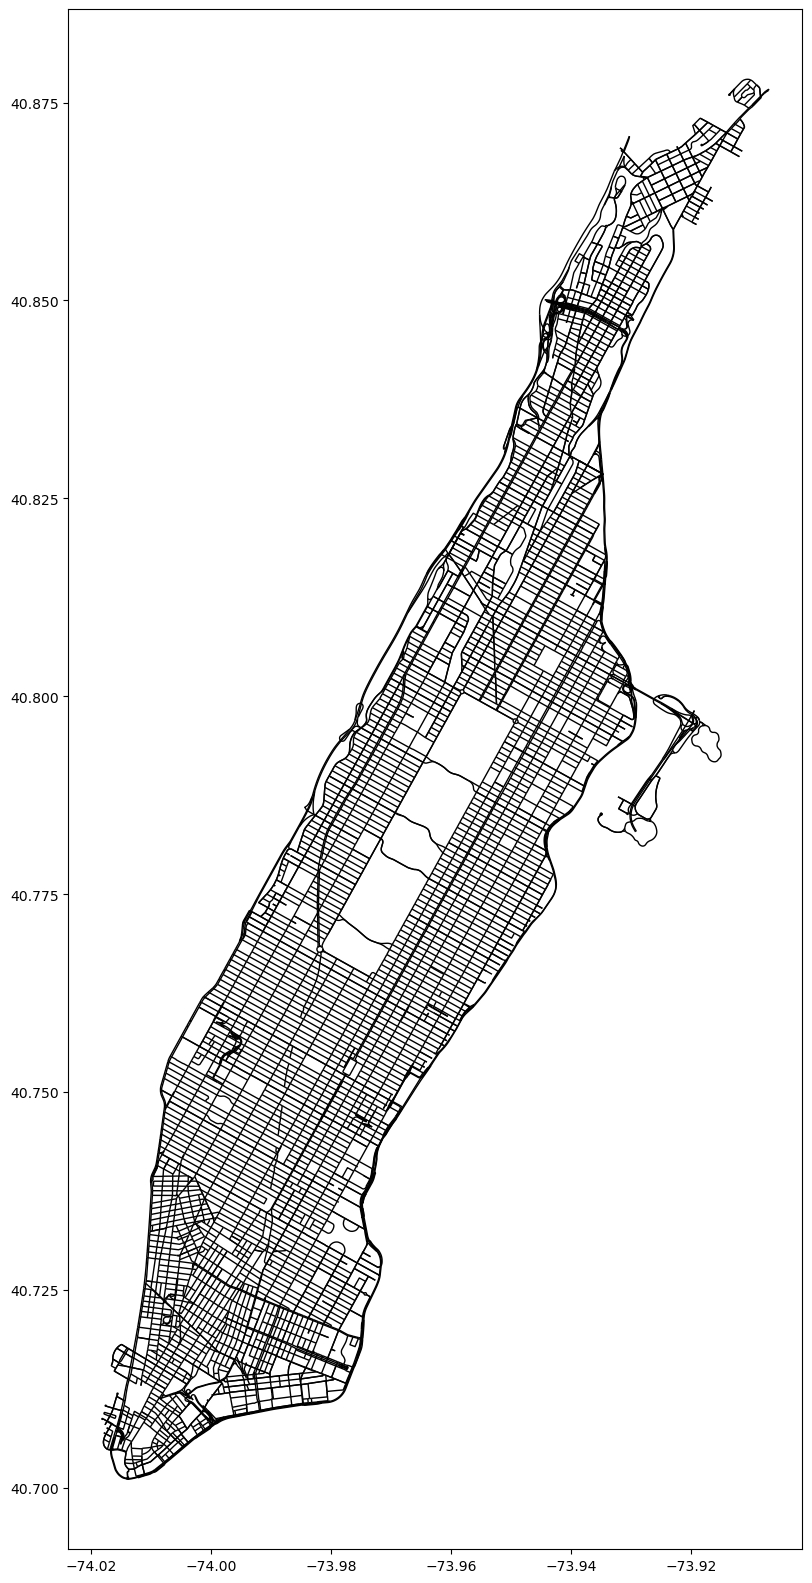
4. Load Crash Data
# Load data into a pandas DataFrame
data = pd.read_csv("Motor_Vehicle_Collisions_Crashes.csv")data| CRASH DATE | CRASH TIME | BOROUGH | ZIP CODE | LATITUDE | LONGITUDE | LOCATION | ON STREET NAME | CROSS STREET NAME | OFF STREET NAME | NUMBER OF PERSONS INJURED | NUMBER OF PERSONS KILLED | NUMBER OF PEDESTRIANS INJURED | NUMBER OF PEDESTRIANS KILLED | NUMBER OF CYCLIST INJURED | NUMBER OF CYCLIST KILLED | NUMBER OF MOTORIST INJURED | NUMBER OF MOTORIST KILLED | CONTRIBUTING FACTOR VEHICLE 1 | CONTRIBUTING FACTOR VEHICLE 2 | CONTRIBUTING FACTOR VEHICLE 3 | CONTRIBUTING FACTOR VEHICLE 4 | CONTRIBUTING FACTOR VEHICLE 5 | COLLISION_ID | VEHICLE TYPE CODE 1 | VEHICLE TYPE CODE 2 | VEHICLE TYPE CODE 3 | VEHICLE TYPE CODE 4 | VEHICLE TYPE CODE 5 | |
|---|---|---|---|---|---|---|---|---|---|---|---|---|---|---|---|---|---|---|---|---|---|---|---|---|---|---|---|---|---|
| 0 | 05/01/2021 | 13:30 | MANHATTAN | 10029.0 | 40.796300 | -73.938290 | (40.7963, -73.93829) | EAST 115 STREET | 2 AVENUE | NaN | 0 | 0 | 0 | 0 | 0 | 0 | 0 | 0 | Passing or Lane Usage Improper | Unspecified | NaN | NaN | NaN | 4412937 | Bus | Sedan | NaN | NaN | NaN |
| 1 | 05/01/2021 | 17:50 | MANHATTAN | 10012.0 | 40.720936 | -73.993805 | (40.720936, -73.993805) | BOWERY | SPRING STREET | NaN | 1 | 0 | 0 | 0 | 0 | 0 | 1 | 0 | Driver Inattention/Distraction | Unspecified | NaN | NaN | NaN | 4412445 | Sedan | Sedan | NaN | NaN | NaN |
| 2 | 05/01/2021 | 13:30 | MANHATTAN | 10128.0 | 40.780693 | -73.946600 | (40.780693, -73.9466) | EAST 92 STREET | 1 AVENUE | NaN | 0 | 0 | 0 | 0 | 0 | 0 | 0 | 0 | Driver Inattention/Distraction | Unspecified | NaN | NaN | NaN | 4414390 | AMBULANCE | Sedan | NaN | NaN | NaN |
| 3 | 05/01/2021 | 9:40 | MANHATTAN | 10026.0 | 40.800537 | -73.948360 | (40.800537, -73.94836) | NaN | NaN | 40 WEST 115 STREET | 0 | 0 | 0 | 0 | 0 | 0 | 0 | 0 | Backing Unsafely | Unspecified | NaN | NaN | NaN | 4417017 | Station Wagon/Sport Utility Vehicle | NaN | NaN | NaN | NaN |
| 4 | 05/01/2021 | 23:03 | MANHATTAN | 10009.0 | 40.726864 | -73.979910 | (40.726864, -73.97991) | AVENUE B | EAST 10 STREET | NaN | 1 | 0 | 0 | 0 | 1 | 0 | 0 | 0 | Driver Inattention/Distraction | Driver Inattention/Distraction | NaN | NaN | NaN | 4412243 | Bike | NaN | NaN | NaN | NaN |
| ... | ... | ... | ... | ... | ... | ... | ... | ... | ... | ... | ... | ... | ... | ... | ... | ... | ... | ... | ... | ... | ... | ... | ... | ... | ... | ... | ... | ... | ... |
| 32364 | 12/31/2023 | 23:18 | MANHATTAN | 10030.0 | 40.819670 | -73.944240 | (40.81967, -73.94424) | 8 AVENUE | WEST 140 STREET | NaN | 0 | 0 | 0 | 0 | 0 | 0 | 0 | 0 | Driver Inattention/Distraction | NaN | NaN | NaN | NaN | 4692572 | Sedan | NaN | NaN | NaN | NaN |
| 32365 | 12/31/2023 | 18:03 | MANHATTAN | 10039.0 | 40.824130 | -73.940980 | (40.82413, -73.94098) | 8 AVENUE | WEST 147 STREET | NaN | 1 | 0 | 1 | 0 | 0 | 0 | 0 | 0 | Unspecified | NaN | NaN | NaN | NaN | 4692571 | NaN | NaN | NaN | NaN | NaN |
| 32366 | 12/31/2023 | 14:00 | MANHATTAN | 10028.0 | 40.777890 | -73.955890 | (40.77789, -73.95589) | NaN | NaN | 160 EAST 84 STREET | 0 | 0 | 0 | 0 | 0 | 0 | 0 | 0 | Driver Inattention/Distraction | Unspecified | NaN | NaN | NaN | 4692524 | Sedan | Sedan | NaN | NaN | NaN |
| 32367 | 12/31/2023 | 21:34 | MANHATTAN | 10033.0 | 40.849308 | -73.931920 | (40.849308, -73.93192) | WEST 182 STREET | AUDUBON AVENUE | NaN | 0 | 0 | 0 | 0 | 0 | 0 | 0 | 0 | Unspecified | Unspecified | NaN | NaN | NaN | 4692192 | Station Wagon/Sport Utility Vehicle | Sedan | NaN | NaN | NaN |
| 32368 | 12/31/2023 | 0:38 | MANHATTAN | 10006.0 | 40.709496 | -74.013900 | (40.709496, -74.0139) | ALBANY STREET | WASHINGTON STREET | NaN | 0 | 0 | 0 | 0 | 0 | 0 | 0 | 0 | Other Vehicular | Unspecified | NaN | NaN | NaN | 4692585 | Sedan | Pick-up Truck | NaN | NaN | NaN |
32369 rows × 29 columns
5. Convert the crash data to a GeoDataFrame
from shapely.geometry import Point
# Check if the necessary columns exist
if 'LATITUDE' in data.columns and 'LONGITUDE' in data.columns:
# Create a geometry column using the DEC_LAT and DEC_LONG columns
geometry = [Point(xy) for xy in zip(data['LONGITUDE'], data['LATITUDE'])]
# Create a GeoDataFrame
gdf = gpd.GeoDataFrame(data, geometry=geometry)
# Set the coordinate reference system (CRS) to WGS 84 (EPSG:4326)
gdf.set_crs(epsg=4326, inplace=True)
# Display the first few rows of the GeoDataFrame
print(gdf.head())
else:
print("The DataFrame does not contain 'DEC_LAT' and 'DEC_LONG' columns.") CRASH DATE CRASH TIME BOROUGH ZIP CODE LATITUDE LONGITUDE \
0 05/01/2021 13:30 MANHATTAN 10029.0 40.796300 -73.938290
1 05/01/2021 17:50 MANHATTAN 10012.0 40.720936 -73.993805
2 05/01/2021 13:30 MANHATTAN 10128.0 40.780693 -73.946600
3 05/01/2021 9:40 MANHATTAN 10026.0 40.800537 -73.948360
4 05/01/2021 23:03 MANHATTAN 10009.0 40.726864 -73.979910
LOCATION ON STREET NAME CROSS STREET NAME \
0 (40.7963, -73.93829) EAST 115 STREET 2 AVENUE
1 (40.720936, -73.993805) BOWERY SPRING STREET
2 (40.780693, -73.9466) EAST 92 STREET 1 AVENUE
3 (40.800537, -73.94836) NaN NaN
4 (40.726864, -73.97991) AVENUE B EAST 10 STREET
OFF STREET NAME NUMBER OF PERSONS INJURED \
0 NaN 0
1 NaN 1
2 NaN 0
3 40 WEST 115 STREET 0
4 NaN 1
NUMBER OF PERSONS KILLED NUMBER OF PEDESTRIANS INJURED \
0 0 0
1 0 0
2 0 0
3 0 0
4 0 0
NUMBER OF PEDESTRIANS KILLED NUMBER OF CYCLIST INJURED \
0 0 0
1 0 0
2 0 0
3 0 0
4 0 1
NUMBER OF CYCLIST KILLED NUMBER OF MOTORIST INJURED \
0 0 0
1 0 1
2 0 0
3 0 0
4 0 0
NUMBER OF MOTORIST KILLED CONTRIBUTING FACTOR VEHICLE 1 \
0 0 Passing or Lane Usage Improper
1 0 Driver Inattention/Distraction
2 0 Driver Inattention/Distraction
3 0 Backing Unsafely
4 0 Driver Inattention/Distraction
CONTRIBUTING FACTOR VEHICLE 2 CONTRIBUTING FACTOR VEHICLE 3 \
0 Unspecified NaN
1 Unspecified NaN
2 Unspecified NaN
3 Unspecified NaN
4 Driver Inattention/Distraction NaN
CONTRIBUTING FACTOR VEHICLE 4 CONTRIBUTING FACTOR VEHICLE 5 COLLISION_ID \
0 NaN NaN 4412937
1 NaN NaN 4412445
2 NaN NaN 4414390
3 NaN NaN 4417017
4 NaN NaN 4412243
VEHICLE TYPE CODE 1 VEHICLE TYPE CODE 2 \
0 Bus Sedan
1 Sedan Sedan
2 AMBULANCE Sedan
3 Station Wagon/Sport Utility Vehicle NaN
4 Bike NaN
VEHICLE TYPE CODE 3 VEHICLE TYPE CODE 4 VEHICLE TYPE CODE 5 \
0 NaN NaN NaN
1 NaN NaN NaN
2 NaN NaN NaN
3 NaN NaN NaN
4 NaN NaN NaN
geometry
0 POINT (-73.93829 40.79630)
1 POINT (-73.99380 40.72094)
2 POINT (-73.94660 40.78069)
3 POINT (-73.94836 40.80054)
4 POINT (-73.97991 40.72686) 6. Trim the crash data to Center City
# Assuming edges_gdf is your GeoDataFrame from part 1.3
manhattan_boundary = edges_gdf.geometry.unary_union.convex_hull
# Filter the crash GeoDataFrame to only include crashes within the boundary
manhattan_crashes = gdf[gdf.geometry.within(manhattan_boundary)]
# Display the number of crashes within the Center City boundary
print(f"Number of crashes within manhattan: {len(manhattan_crashes)}")
# Display the first few rows of the filtered GeoDataFrame
manhattan_crashes.head()Number of crashes within manhattan: 31042| CRASH DATE | CRASH TIME | BOROUGH | ZIP CODE | LATITUDE | LONGITUDE | LOCATION | ON STREET NAME | CROSS STREET NAME | OFF STREET NAME | NUMBER OF PERSONS INJURED | NUMBER OF PERSONS KILLED | NUMBER OF PEDESTRIANS INJURED | NUMBER OF PEDESTRIANS KILLED | NUMBER OF CYCLIST INJURED | NUMBER OF CYCLIST KILLED | NUMBER OF MOTORIST INJURED | NUMBER OF MOTORIST KILLED | CONTRIBUTING FACTOR VEHICLE 1 | CONTRIBUTING FACTOR VEHICLE 2 | CONTRIBUTING FACTOR VEHICLE 3 | CONTRIBUTING FACTOR VEHICLE 4 | CONTRIBUTING FACTOR VEHICLE 5 | COLLISION_ID | VEHICLE TYPE CODE 1 | VEHICLE TYPE CODE 2 | VEHICLE TYPE CODE 3 | VEHICLE TYPE CODE 4 | VEHICLE TYPE CODE 5 | geometry | |
|---|---|---|---|---|---|---|---|---|---|---|---|---|---|---|---|---|---|---|---|---|---|---|---|---|---|---|---|---|---|---|
| 0 | 05/01/2021 | 13:30 | MANHATTAN | 10029.0 | 40.796300 | -73.938290 | (40.7963, -73.93829) | EAST 115 STREET | 2 AVENUE | NaN | 0 | 0 | 0 | 0 | 0 | 0 | 0 | 0 | Passing or Lane Usage Improper | Unspecified | NaN | NaN | NaN | 4412937 | Bus | Sedan | NaN | NaN | NaN | POINT (-73.93829 40.79630) |
| 1 | 05/01/2021 | 17:50 | MANHATTAN | 10012.0 | 40.720936 | -73.993805 | (40.720936, -73.993805) | BOWERY | SPRING STREET | NaN | 1 | 0 | 0 | 0 | 0 | 0 | 1 | 0 | Driver Inattention/Distraction | Unspecified | NaN | NaN | NaN | 4412445 | Sedan | Sedan | NaN | NaN | NaN | POINT (-73.99380 40.72094) |
| 2 | 05/01/2021 | 13:30 | MANHATTAN | 10128.0 | 40.780693 | -73.946600 | (40.780693, -73.9466) | EAST 92 STREET | 1 AVENUE | NaN | 0 | 0 | 0 | 0 | 0 | 0 | 0 | 0 | Driver Inattention/Distraction | Unspecified | NaN | NaN | NaN | 4414390 | AMBULANCE | Sedan | NaN | NaN | NaN | POINT (-73.94660 40.78069) |
| 3 | 05/01/2021 | 9:40 | MANHATTAN | 10026.0 | 40.800537 | -73.948360 | (40.800537, -73.94836) | NaN | NaN | 40 WEST 115 STREET | 0 | 0 | 0 | 0 | 0 | 0 | 0 | 0 | Backing Unsafely | Unspecified | NaN | NaN | NaN | 4417017 | Station Wagon/Sport Utility Vehicle | NaN | NaN | NaN | NaN | POINT (-73.94836 40.80054) |
| 4 | 05/01/2021 | 23:03 | MANHATTAN | 10009.0 | 40.726864 | -73.979910 | (40.726864, -73.97991) | AVENUE B | EAST 10 STREET | NaN | 1 | 0 | 0 | 0 | 1 | 0 | 0 | 0 | Driver Inattention/Distraction | Driver Inattention/Distraction | NaN | NaN | NaN | 4412243 | Bike | NaN | NaN | NaN | NaN | POINT (-73.97991 40.72686) |
7. Re-project our data into an approriate CRS2263
import osmnx as ox
# Assuming G is your graph object
# Project the graph to the Philadelphia state plane CRS (EPSG:2272)
G_projected = ox.project_graph(G, to_crs='EPSG:2263')
# Project the crash GeoDataFrame to the Philadelphia state plane CRS (EPSG:2272)
manhattan_crashes_projected = manhattan_crashes.to_crs(epsg=2263)
# Display the first few rows of the projected GeoDataFrame
manhattan_crashes_projected.head()
# Create a plot
fig, ax = plt.subplots(figsize=(12, 12))
# Plot the street network
edges_gdf_projected = ox.graph_to_gdfs(G_projected, nodes=False)
edges_gdf_projected.plot(ax=ax, linewidth=1, edgecolor='gray', label='Street Network')
# Plot the crash locations
manhattan_crashes_projected.plot(ax=ax, marker='o', color='red', markersize=5, label='Crashes')
# Add a title and legend
plt.title('Crash Locations in Manhattan with Street Network')
plt.legend()
# Show the plot
plt.show()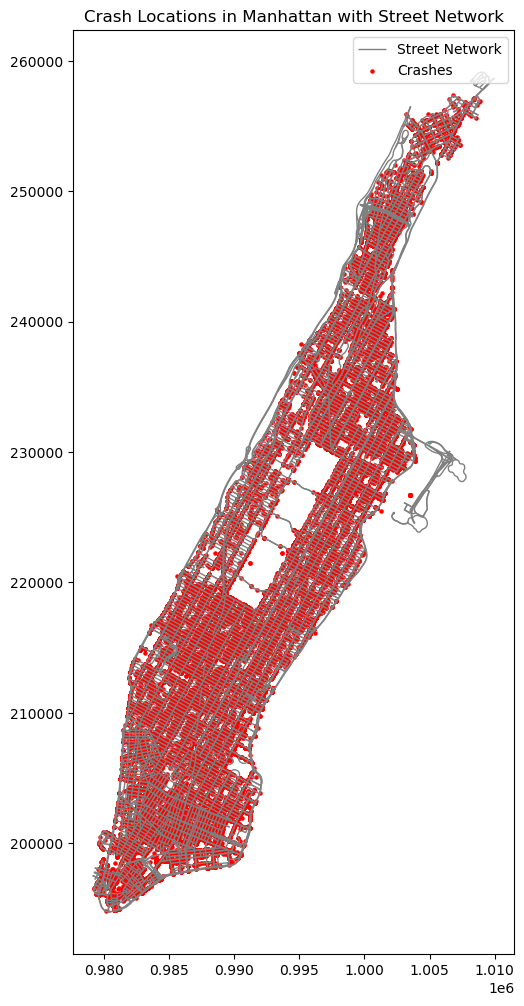
8. Find the nearest edge for each crash
See: ox.distance.nearest_edges(). It takes three arguments:
the network graph the longitude of your crash data (the x attribute of the geometry column) the latitude of your crash data (the y attribute of the geometry column) You will get a numpy array with 3 columns that represent (u, v, key) where each u and v are the node IDs that the edge links together. We will ignore the key value for our analysis.
# Extract x and y coordinates from the geometry column
crash_x = manhattan_crashes_projected.geometry.x
crash_y = manhattan_crashes_projected.geometry.y
# Find the nearest edges for each crash
nearest_edges = ox.distance.nearest_edges(G_projected, crash_x, crash_y)
# Convert the result to a numpy array
nearest_edges_array = np.array(nearest_edges)
# Display the first few results
print(nearest_edges_array[:5])
# Extract only the u and v columns, ignoring the key
nearest_edges_uv = nearest_edges_array[:, :2]
# Display the first few u, v pairs
print(nearest_edges_uv[:5])[[4207962275 42443081 0]
[ 42437605 1773076509 0]
[ 42443048 42448745 0]
[ 42435387 42446772 0]
[ 42430924 42430938 0]]
[[4207962275 42443081]
[ 42437605 1773076509]
[ 42443048 42448745]
[ 42435387 42446772]
[ 42430924 42430938]]9. Calculate the total number of crashes per street
# Create a DataFrame from the nearest edges data
edges_df = pd.DataFrame(nearest_edges_array, columns=['u', 'v', 'key'])
# Group by 'u' and 'v' and calculate the size of each group
crash_counts = edges_df.groupby(['u', 'v']).size().reset_index(name='crash_count')
# Display the resulting DataFrame
crash_counts| u | v | crash_count | |
|---|---|---|---|
| 0 | 42421728 | 42432736 | 2 |
| 1 | 42421731 | 42437916 | 1 |
| 2 | 42421737 | 42437917 | 2 |
| 3 | 42421741 | 42432756 | 1 |
| 4 | 42421751 | 42421749 | 1 |
| ... | ... | ... | ... |
| 5796 | 12162436970 | 42455357 | 2 |
| 5797 | 12181309686 | 4597668039 | 5 |
| 5798 | 12299314857 | 12299314860 | 1 |
| 5799 | 12299314860 | 42438476 | 3 |
| 5800 | 12374690312 | 42433537 | 1 |
5801 rows × 3 columns
10. Merge your edges GeoDataFrame and crash count DataFrame
# Convert the projected graph to a GeoDataFrame for edges
edges_gdf_projected = ox.graph_to_gdfs(G_projected, nodes=False)
# Merge the edges GeoDataFrame with the crash counts DataFrame
merged_df = edges_gdf_projected.merge(crash_counts, on=['u', 'v'], how='left')
# Fill missing crash count values with zero
merged_df['crash_count'] = merged_df['crash_count'].fillna(0)
# Display the first few rows of the merged DataFrame
merged_df
# Filter out rows where crash_count is 0.0
filtered_df = merged_df[merged_df['crash_count'] > 0.0]
# Display the first few rows of the filtered DataFrame
filtered_df| u | v | osmid | name | highway | maxspeed | oneway | reversed | length | geometry | lanes | ref | access | bridge | tunnel | width | junction | crash_count | |
|---|---|---|---|---|---|---|---|---|---|---|---|---|---|---|---|---|---|---|
| 2 | 42421728 | 42432736 | [1271523197, 1271523198] | Central Park West | secondary | 25 mph | False | False | 86.275 | LINESTRING (995312.767 230030.016, 995334.152 ... | NaN | NaN | NaN | NaN | NaN | NaN | NaN | 2.0 |
| 3 | 42435337 | 42437916 | 5670640 | West 105th Street | residential | 25 mph | True | False | 137.996 | LINESTRING (995176.877 229785.340, 995144.253 ... | 1 | NaN | NaN | NaN | NaN | NaN | NaN | 1.0 |
| 6 | 42421731 | 42437916 | 5671485 | Manhattan Avenue | residential | NaN | False | True | 86.149 | LINESTRING (994916.519 230250.770, 994899.394 ... | NaN | NaN | NaN | NaN | NaN | NaN | NaN | 1.0 |
| 11 | 42432736 | 42435341 | 1271523197 | Central Park West | secondary | 25 mph | False | False | 80.116 | LINESTRING (995450.120 230277.316, 995461.822 ... | NaN | NaN | NaN | NaN | NaN | NaN | NaN | 2.0 |
| 13 | 42437916 | 42437917 | 5670640 | West 105th Street | residential | 25 mph | True | False | 135.012 | LINESTRING (994779.437 230003.728, 994751.078 ... | 1 | NaN | NaN | NaN | NaN | NaN | NaN | 8.0 |
| ... | ... | ... | ... | ... | ... | ... | ... | ... | ... | ... | ... | ... | ... | ... | ... | ... | ... | ... |
| 9864 | 7802856372 | 7802856349 | 661227257 | Central Park West | secondary | 25 mph | False | True | 80.457 | LINESTRING (990516.812 221373.627, 990505.794 ... | 4 | NaN | NaN | NaN | NaN | NaN | NaN | 1.0 |
| 9865 | 7802856372 | 7802856356 | [1271523171, 1271523172] | Central Park West | secondary | 25 mph | False | False | 79.496 | LINESTRING (990516.812 221373.627, 990527.802 ... | 4 | NaN | NaN | NaN | NaN | NaN | NaN | 4.0 |
| 9867 | 8288270047 | 246580982 | 5671698 | West 16th Street | residential | 25 mph | True | False | 21.068 | LINESTRING (981879.246 210378.461, 981886.366 ... | 1 | NaN | NaN | NaN | NaN | NaN | NaN | 6.0 |
| 9869 | 8840333851 | 42453952 | 5672377 | Church Street | secondary | 25 mph | True | False | 83.590 | LINESTRING (981444.123 198698.940, 981458.126 ... | 3 | NaN | NaN | NaN | NaN | NaN | NaN | 2.0 |
| 9878 | 11942111842 | 42434962 | [658488325, 658499796, 658499797, 420872214, 6... | NaN | motorway_link | NaN | True | False | 290.747 | LINESTRING (991424.925 211158.515, 991364.955 ... | [2, 1, 3] | NaN | NaN | NaN | NaN | NaN | NaN | 1.0 |
5805 rows × 18 columns
11. Calculate a “Crash Index”
# Step 1: Calculate the crash index
filtered_df['crash_index'] = np.log10(filtered_df['crash_count'] / filtered_df['length'])
# Step 2: Normalize the crash index
min_crash_index = filtered_df['crash_index'].min()
max_crash_index = filtered_df['crash_index'].max()
# Normalize the crash_index to a 0-1 scale
filtered_df['crash_index_normalized'] = (filtered_df['crash_index'] - min_crash_index) / (max_crash_index - min_crash_index)
filtered_dfC:\Users\txx11\mambaforge\envs\musa-550-fall-2023\lib\site-packages\geopandas\geodataframe.py:1538: SettingWithCopyWarning:
A value is trying to be set on a copy of a slice from a DataFrame.
Try using .loc[row_indexer,col_indexer] = value instead
See the caveats in the documentation: https://pandas.pydata.org/pandas-docs/stable/user_guide/indexing.html#returning-a-view-versus-a-copy
super().__setitem__(key, value)
C:\Users\txx11\mambaforge\envs\musa-550-fall-2023\lib\site-packages\geopandas\geodataframe.py:1538: SettingWithCopyWarning:
A value is trying to be set on a copy of a slice from a DataFrame.
Try using .loc[row_indexer,col_indexer] = value instead
See the caveats in the documentation: https://pandas.pydata.org/pandas-docs/stable/user_guide/indexing.html#returning-a-view-versus-a-copy
super().__setitem__(key, value)| u | v | osmid | name | highway | maxspeed | oneway | reversed | length | geometry | lanes | ref | access | bridge | tunnel | width | junction | crash_count | crash_index | crash_index_normalized | |
|---|---|---|---|---|---|---|---|---|---|---|---|---|---|---|---|---|---|---|---|---|
| 2 | 42421728 | 42432736 | [1271523197, 1271523198] | Central Park West | secondary | 25 mph | False | False | 86.275 | LINESTRING (995312.767 230030.016, 995334.152 ... | NaN | NaN | NaN | NaN | NaN | NaN | NaN | 2.0 | -1.634855 | 0.384469 |
| 3 | 42435337 | 42437916 | 5670640 | West 105th Street | residential | 25 mph | True | False | 137.996 | LINESTRING (995176.877 229785.340, 995144.253 ... | 1 | NaN | NaN | NaN | NaN | NaN | NaN | 1.0 | -2.139866 | 0.244838 |
| 6 | 42421731 | 42437916 | 5671485 | Manhattan Avenue | residential | NaN | False | True | 86.149 | LINESTRING (994916.519 230250.770, 994899.394 ... | NaN | NaN | NaN | NaN | NaN | NaN | NaN | 1.0 | -1.935250 | 0.301413 |
| 11 | 42432736 | 42435341 | 1271523197 | Central Park West | secondary | 25 mph | False | False | 80.116 | LINESTRING (995450.120 230277.316, 995461.822 ... | NaN | NaN | NaN | NaN | NaN | NaN | NaN | 2.0 | -1.602689 | 0.393363 |
| 13 | 42437916 | 42437917 | 5670640 | West 105th Street | residential | 25 mph | True | False | 135.012 | LINESTRING (994779.437 230003.728, 994751.078 ... | 1 | NaN | NaN | NaN | NaN | NaN | NaN | 8.0 | -1.227282 | 0.497160 |
| ... | ... | ... | ... | ... | ... | ... | ... | ... | ... | ... | ... | ... | ... | ... | ... | ... | ... | ... | ... | ... |
| 9864 | 7802856372 | 7802856349 | 661227257 | Central Park West | secondary | 25 mph | False | True | 80.457 | LINESTRING (990516.812 221373.627, 990505.794 ... | 4 | NaN | NaN | NaN | NaN | NaN | NaN | 1.0 | -1.905564 | 0.309621 |
| 9865 | 7802856372 | 7802856356 | [1271523171, 1271523172] | Central Park West | secondary | 25 mph | False | False | 79.496 | LINESTRING (990516.812 221373.627, 990527.802 ... | 4 | NaN | NaN | NaN | NaN | NaN | NaN | 4.0 | -1.298285 | 0.477528 |
| 9867 | 8288270047 | 246580982 | 5671698 | West 16th Street | residential | 25 mph | True | False | 21.068 | LINESTRING (981879.246 210378.461, 981886.366 ... | 1 | NaN | NaN | NaN | NaN | NaN | NaN | 6.0 | -0.545472 | 0.685674 |
| 9869 | 8840333851 | 42453952 | 5672377 | Church Street | secondary | 25 mph | True | False | 83.590 | LINESTRING (981444.123 198698.940, 981458.126 ... | 3 | NaN | NaN | NaN | NaN | NaN | NaN | 2.0 | -1.621124 | 0.388266 |
| 9878 | 11942111842 | 42434962 | [658488325, 658499796, 658499797, 420872214, 6... | NaN | motorway_link | NaN | True | False | 290.747 | LINESTRING (991424.925 211158.515, 991364.955 ... | [2, 1, 3] | NaN | NaN | NaN | NaN | NaN | NaN | 1.0 | -2.463515 | 0.155352 |
5805 rows × 20 columns
12. Plot a histogram of the crash index values
import matplotlib.pyplot as plt
# Assuming filtered_df is already defined and contains 'crash_index_normalized'
# Plot a histogram of the normalized crash index values
plt.figure(figsize=(10, 6))
plt.hist(filtered_df['crash_index_normalized'], bins=30, color='skyblue', edgecolor='black')
plt.title('Histogram of Normalized Crash Index')
plt.xlabel('Normalized Crash Index')
plt.ylabel('Frequency')
plt.grid(axis='y', alpha=0.75)
# Show the plot
plt.show()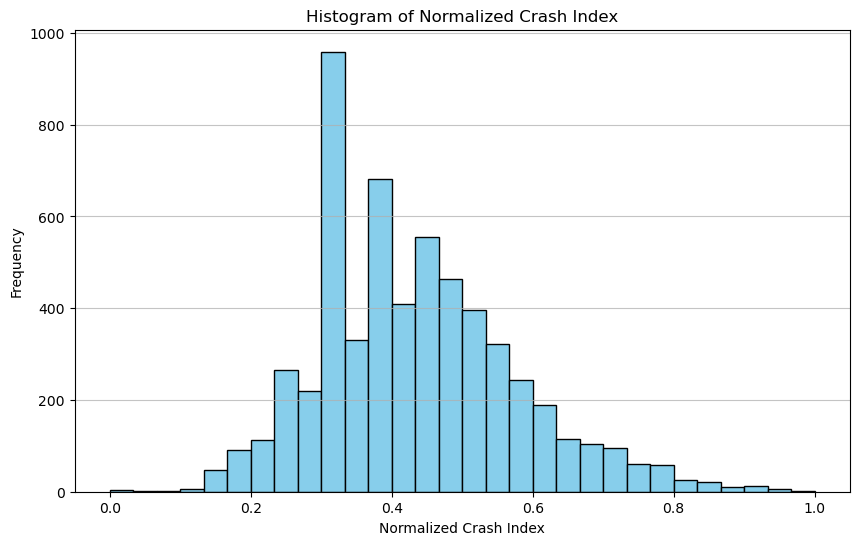
13. Plot an interactive map of the street networks, colored by the crash index
import folium
import geopandas as gpd
import matplotlib.pyplot as plt
# Assuming 'filtered_df' is your GeoDataFrame with the 'crash_index_normalized' column
# Create a base map centered around the Central district with a dark theme
m = folium.Map(location=[40.7826, -73.9656], zoom_start=12, tiles='CartoDB dark_matter')
# Define a function to style the lines based on the crash index
def style_function(feature):
crash_index = feature['properties']['crash_index_normalized']
# Use the 'viridis' colormap for a color gradient
colormap = plt.cm.get_cmap('viridis')
# Get the RGBA color based on the crash index
color = colormap(crash_index) # crash_index should already be normalized [0, 1]
# Convert RGBA to hex
color_hex = '#{:02x}{:02x}{:02x}'.format(int(color[0]*255), int(color[1]*255), int(color[2]*255))
return {
'color': color_hex,
'weight': 3 + crash_index * 2, # Increase line weight for higher crash index
'opacity': 0.8
}
# Add the GeoDataFrame to the map
folium.GeoJson(
filtered_df,
style_function=style_function,
tooltip=folium.GeoJsonTooltip(fields=['name', 'crash_index_normalized']),
).add_to(m)
# Display the map
mC:\Users\txx11\AppData\Local\Temp\ipykernel_2124\3546299534.py:14: MatplotlibDeprecationWarning: The get_cmap function was deprecated in Matplotlib 3.7 and will be removed two minor releases later. Use ``matplotlib.colormaps[name]`` or ``matplotlib.colormaps.get_cmap(obj)`` instead.
colormap = plt.cm.get_cmap('viridis')Make this Notebook Trusted to load map: File -> Trust Notebook
m.save('mahattan_crash_index_map_dark.html')C:\Users\txx11\AppData\Local\Temp\ipykernel_2124\3546299534.py:14: MatplotlibDeprecationWarning: The get_cmap function was deprecated in Matplotlib 3.7 and will be removed two minor releases later. Use ``matplotlib.colormaps[name]`` or ``matplotlib.colormaps.get_cmap(obj)`` instead.
colormap = plt.cm.get_cmap('viridis')Through the street network map of crash index, it is obvious to identify areas with high risk of crashes. From the map, areas near Chinatown (Lower East) and Midtown West.
Part 2: Density Map of Crashes by time of the day
In the following data analysis, we dive deeper into the crash density in different time of the day to see how crash density varies. We choose larger dataset of the crash data ranging from July 2012 to Dec 2024, with 2.14 million rows.
#load large data
dat2 = pd.read_csv("Crash data_large.csv")if 'LATITUDE' in dat2.columns and 'LONGITUDE' in data.columns:
# Create a geometry column using the DEC_LAT and DEC_LONG columns
geometry = [Point(xy) for xy in zip(data['LONGITUDE'], data['LATITUDE'])]
# Create a GeoDataFrame
gdf2 = gpd.GeoDataFrame(data, geometry=geometry)
# Set the coordinate reference system (CRS) to WGS 84 (EPSG:4326)
gdf2.set_crs(epsg=4326, inplace=True)
# Filter the crash GeoDataFrame to only include crashes within the boundary
dat2 = gdf[gdf.geometry.within(manhattan_boundary)]
# Display the number of crashes within the Center City boundary
print(f"Number of crashes within manhattan: {len(manhattan_crashes)}")
# Display the first few rows of the filtered GeoDataFrame
dat2.head()Number of crashes within manhattan: 31042| CRASH DATE | CRASH TIME | BOROUGH | ZIP CODE | LATITUDE | LONGITUDE | LOCATION | ON STREET NAME | CROSS STREET NAME | OFF STREET NAME | NUMBER OF PERSONS INJURED | NUMBER OF PERSONS KILLED | NUMBER OF PEDESTRIANS INJURED | NUMBER OF PEDESTRIANS KILLED | NUMBER OF CYCLIST INJURED | NUMBER OF CYCLIST KILLED | NUMBER OF MOTORIST INJURED | NUMBER OF MOTORIST KILLED | CONTRIBUTING FACTOR VEHICLE 1 | CONTRIBUTING FACTOR VEHICLE 2 | CONTRIBUTING FACTOR VEHICLE 3 | CONTRIBUTING FACTOR VEHICLE 4 | CONTRIBUTING FACTOR VEHICLE 5 | COLLISION_ID | VEHICLE TYPE CODE 1 | VEHICLE TYPE CODE 2 | VEHICLE TYPE CODE 3 | VEHICLE TYPE CODE 4 | VEHICLE TYPE CODE 5 | geometry | |
|---|---|---|---|---|---|---|---|---|---|---|---|---|---|---|---|---|---|---|---|---|---|---|---|---|---|---|---|---|---|---|
| 0 | 05/01/2021 | 13:30 | MANHATTAN | 10029.0 | 40.796300 | -73.938290 | (40.7963, -73.93829) | EAST 115 STREET | 2 AVENUE | NaN | 0 | 0 | 0 | 0 | 0 | 0 | 0 | 0 | Passing or Lane Usage Improper | Unspecified | NaN | NaN | NaN | 4412937 | Bus | Sedan | NaN | NaN | NaN | POINT (-73.93829 40.79630) |
| 1 | 05/01/2021 | 17:50 | MANHATTAN | 10012.0 | 40.720936 | -73.993805 | (40.720936, -73.993805) | BOWERY | SPRING STREET | NaN | 1 | 0 | 0 | 0 | 0 | 0 | 1 | 0 | Driver Inattention/Distraction | Unspecified | NaN | NaN | NaN | 4412445 | Sedan | Sedan | NaN | NaN | NaN | POINT (-73.99380 40.72094) |
| 2 | 05/01/2021 | 13:30 | MANHATTAN | 10128.0 | 40.780693 | -73.946600 | (40.780693, -73.9466) | EAST 92 STREET | 1 AVENUE | NaN | 0 | 0 | 0 | 0 | 0 | 0 | 0 | 0 | Driver Inattention/Distraction | Unspecified | NaN | NaN | NaN | 4414390 | AMBULANCE | Sedan | NaN | NaN | NaN | POINT (-73.94660 40.78069) |
| 3 | 05/01/2021 | 9:40 | MANHATTAN | 10026.0 | 40.800537 | -73.948360 | (40.800537, -73.94836) | NaN | NaN | 40 WEST 115 STREET | 0 | 0 | 0 | 0 | 0 | 0 | 0 | 0 | Backing Unsafely | Unspecified | NaN | NaN | NaN | 4417017 | Station Wagon/Sport Utility Vehicle | NaN | NaN | NaN | NaN | POINT (-73.94836 40.80054) |
| 4 | 05/01/2021 | 23:03 | MANHATTAN | 10009.0 | 40.726864 | -73.979910 | (40.726864, -73.97991) | AVENUE B | EAST 10 STREET | NaN | 1 | 0 | 0 | 0 | 1 | 0 | 0 | 0 | Driver Inattention/Distraction | Driver Inattention/Distraction | NaN | NaN | NaN | 4412243 | Bike | NaN | NaN | NaN | NaN | POINT (-73.97991 40.72686) |
# Convert 'CRASH TIME' to datetime format if it's not already in datetime
dat2['CRASH TIME'] = pd.to_datetime(dat2['CRASH TIME'], format='%H:%M')
# Extract the hour from 'CRASH TIME' and create a new column called 'CRASH HOUR'
dat2['CRASH HOUR'] = dat2['CRASH TIME'].dt.hour
dat2C:\Users\txx11\mambaforge\envs\musa-550-fall-2023\lib\site-packages\geopandas\geodataframe.py:1538: SettingWithCopyWarning:
A value is trying to be set on a copy of a slice from a DataFrame.
Try using .loc[row_indexer,col_indexer] = value instead
See the caveats in the documentation: https://pandas.pydata.org/pandas-docs/stable/user_guide/indexing.html#returning-a-view-versus-a-copy
super().__setitem__(key, value)
C:\Users\txx11\mambaforge\envs\musa-550-fall-2023\lib\site-packages\geopandas\geodataframe.py:1538: SettingWithCopyWarning:
A value is trying to be set on a copy of a slice from a DataFrame.
Try using .loc[row_indexer,col_indexer] = value instead
See the caveats in the documentation: https://pandas.pydata.org/pandas-docs/stable/user_guide/indexing.html#returning-a-view-versus-a-copy
super().__setitem__(key, value)| CRASH DATE | CRASH TIME | BOROUGH | ZIP CODE | LATITUDE | LONGITUDE | LOCATION | ON STREET NAME | CROSS STREET NAME | OFF STREET NAME | NUMBER OF PERSONS INJURED | NUMBER OF PERSONS KILLED | NUMBER OF PEDESTRIANS INJURED | NUMBER OF PEDESTRIANS KILLED | NUMBER OF CYCLIST INJURED | NUMBER OF CYCLIST KILLED | NUMBER OF MOTORIST INJURED | NUMBER OF MOTORIST KILLED | CONTRIBUTING FACTOR VEHICLE 1 | CONTRIBUTING FACTOR VEHICLE 2 | CONTRIBUTING FACTOR VEHICLE 3 | CONTRIBUTING FACTOR VEHICLE 4 | CONTRIBUTING FACTOR VEHICLE 5 | COLLISION_ID | VEHICLE TYPE CODE 1 | VEHICLE TYPE CODE 2 | VEHICLE TYPE CODE 3 | VEHICLE TYPE CODE 4 | VEHICLE TYPE CODE 5 | geometry | CRASH HOUR | |
|---|---|---|---|---|---|---|---|---|---|---|---|---|---|---|---|---|---|---|---|---|---|---|---|---|---|---|---|---|---|---|---|
| 0 | 05/01/2021 | 1900-01-01 13:30:00 | MANHATTAN | 10029.0 | 40.796300 | -73.938290 | (40.7963, -73.93829) | EAST 115 STREET | 2 AVENUE | NaN | 0 | 0 | 0 | 0 | 0 | 0 | 0 | 0 | Passing or Lane Usage Improper | Unspecified | NaN | NaN | NaN | 4412937 | Bus | Sedan | NaN | NaN | NaN | POINT (-73.93829 40.79630) | 13 |
| 1 | 05/01/2021 | 1900-01-01 17:50:00 | MANHATTAN | 10012.0 | 40.720936 | -73.993805 | (40.720936, -73.993805) | BOWERY | SPRING STREET | NaN | 1 | 0 | 0 | 0 | 0 | 0 | 1 | 0 | Driver Inattention/Distraction | Unspecified | NaN | NaN | NaN | 4412445 | Sedan | Sedan | NaN | NaN | NaN | POINT (-73.99380 40.72094) | 17 |
| 2 | 05/01/2021 | 1900-01-01 13:30:00 | MANHATTAN | 10128.0 | 40.780693 | -73.946600 | (40.780693, -73.9466) | EAST 92 STREET | 1 AVENUE | NaN | 0 | 0 | 0 | 0 | 0 | 0 | 0 | 0 | Driver Inattention/Distraction | Unspecified | NaN | NaN | NaN | 4414390 | AMBULANCE | Sedan | NaN | NaN | NaN | POINT (-73.94660 40.78069) | 13 |
| 3 | 05/01/2021 | 1900-01-01 09:40:00 | MANHATTAN | 10026.0 | 40.800537 | -73.948360 | (40.800537, -73.94836) | NaN | NaN | 40 WEST 115 STREET | 0 | 0 | 0 | 0 | 0 | 0 | 0 | 0 | Backing Unsafely | Unspecified | NaN | NaN | NaN | 4417017 | Station Wagon/Sport Utility Vehicle | NaN | NaN | NaN | NaN | POINT (-73.94836 40.80054) | 9 |
| 4 | 05/01/2021 | 1900-01-01 23:03:00 | MANHATTAN | 10009.0 | 40.726864 | -73.979910 | (40.726864, -73.97991) | AVENUE B | EAST 10 STREET | NaN | 1 | 0 | 0 | 0 | 1 | 0 | 0 | 0 | Driver Inattention/Distraction | Driver Inattention/Distraction | NaN | NaN | NaN | 4412243 | Bike | NaN | NaN | NaN | NaN | POINT (-73.97991 40.72686) | 23 |
| ... | ... | ... | ... | ... | ... | ... | ... | ... | ... | ... | ... | ... | ... | ... | ... | ... | ... | ... | ... | ... | ... | ... | ... | ... | ... | ... | ... | ... | ... | ... | ... |
| 32364 | 12/31/2023 | 1900-01-01 23:18:00 | MANHATTAN | 10030.0 | 40.819670 | -73.944240 | (40.81967, -73.94424) | 8 AVENUE | WEST 140 STREET | NaN | 0 | 0 | 0 | 0 | 0 | 0 | 0 | 0 | Driver Inattention/Distraction | NaN | NaN | NaN | NaN | 4692572 | Sedan | NaN | NaN | NaN | NaN | POINT (-73.94424 40.81967) | 23 |
| 32365 | 12/31/2023 | 1900-01-01 18:03:00 | MANHATTAN | 10039.0 | 40.824130 | -73.940980 | (40.82413, -73.94098) | 8 AVENUE | WEST 147 STREET | NaN | 1 | 0 | 1 | 0 | 0 | 0 | 0 | 0 | Unspecified | NaN | NaN | NaN | NaN | 4692571 | NaN | NaN | NaN | NaN | NaN | POINT (-73.94098 40.82413) | 18 |
| 32366 | 12/31/2023 | 1900-01-01 14:00:00 | MANHATTAN | 10028.0 | 40.777890 | -73.955890 | (40.77789, -73.95589) | NaN | NaN | 160 EAST 84 STREET | 0 | 0 | 0 | 0 | 0 | 0 | 0 | 0 | Driver Inattention/Distraction | Unspecified | NaN | NaN | NaN | 4692524 | Sedan | Sedan | NaN | NaN | NaN | POINT (-73.95589 40.77789) | 14 |
| 32367 | 12/31/2023 | 1900-01-01 21:34:00 | MANHATTAN | 10033.0 | 40.849308 | -73.931920 | (40.849308, -73.93192) | WEST 182 STREET | AUDUBON AVENUE | NaN | 0 | 0 | 0 | 0 | 0 | 0 | 0 | 0 | Unspecified | Unspecified | NaN | NaN | NaN | 4692192 | Station Wagon/Sport Utility Vehicle | Sedan | NaN | NaN | NaN | POINT (-73.93192 40.84931) | 21 |
| 32368 | 12/31/2023 | 1900-01-01 00:38:00 | MANHATTAN | 10006.0 | 40.709496 | -74.013900 | (40.709496, -74.0139) | ALBANY STREET | WASHINGTON STREET | NaN | 0 | 0 | 0 | 0 | 0 | 0 | 0 | 0 | Other Vehicular | Unspecified | NaN | NaN | NaN | 4692585 | Sedan | Pick-up Truck | NaN | NaN | NaN | POINT (-74.01390 40.70950) | 0 |
31042 rows × 31 columns
from colorcet import fire
import hvplot.pandas
import holoviews as hv
import geoviews as gvplot1 = dat2.hvplot.points(
geo=True, # Enables geographic plotting
x='LONGITUDE', # Longitude for x-axis
y='LATITUDE', # Latitude for y-axis
frame_width=800, # Set frame width
frame_height=600, # Set frame height
cmap=fire, # Use the Fire colormap
datashade=True, # Enable datashading for large datasets
crs=4326,
title='Manhattan Crashes' # Set the plot title
)
# Add a dark background map
bg = gv.tile_sources.CartoDark
# Combine the background map and the plot
bg * plot1plot2 = dat2.hvplot.points(
geo=True, # Enables geographic plotting
x='LONGITUDE', # Longitude for x-axis
y='LATITUDE', # Latitude for y-axis
frame_width=800, # Set frame width
frame_height=600, # Set frame height
cmap=fire, # Use the Fire colormap
datashade=True, # Enable datashading for large datasets
crs=4326,
groupby = "CRASH HOUR",
title='Manhattan Crashes' # Set the plot title
)
# Add a dark background map
bg = gv.tile_sources.CartoDark
# Combine the background map and the plot
bg * plot2These two graphs follow the similar spatial pattern as the street network for crashes, that most crashes are concentrated in lower east side and midtown west. As for the time of the day, rush hours (8-9 a.m. or 5-6 p.m.) suggest higher density of crashes in total.
Part 3: Density Map of Crashes due to pass/following too closely
Our research would also like to focus on crashes related to traffic congestion. In the chart below, which are top 10 causes of traffic crashes, passing too closely and following too closely add up to a large number. These two causes are mostly likely to associate with congestion. Therefore, we wish to have a look at the spatial pattern of crashes caused by these two factors as well.
import altair as alt
# Count the occurrences of each contributing factor
factor_counts = manhattan_crashes["CONTRIBUTING FACTOR VEHICLE 1"].value_counts().reset_index()
factor_counts.columns = ["Contributing Factor", "Frequency"]
# Select the top 10 contributing factors
top_10_factors = factor_counts.head(10)
# Create a bar chart using Altair
chart = alt.Chart(top_10_factors).mark_bar().encode(
x=alt.X("Frequency:Q", title="Frequency"),
y=alt.Y("Contributing Factor:N", sort='-x', title="Contributing Factor"),
color=alt.Color("Contributing Factor:N", legend=None), # Color by factor, no legend
tooltip=[
alt.Tooltip("Contributing Factor:N", title="Factor"),
alt.Tooltip("Frequency:Q", title="Count")
]
).properties(
title="Top 10 Contributing Factors for Vehicle Crashes in Manhattan (2021-2023)",
width=600,
height=400
)
# Display the chart
chartmanhattan_crashes_filtered = manhattan_crashes[
(manhattan_crashes["CONTRIBUTING FACTOR VEHICLE 1"] == "Passing Too Closely") |
(manhattan_crashes["CONTRIBUTING FACTOR VEHICLE 1"] == "Following Too Closely")
]
manhattan_crashes_filtered| CRASH DATE | CRASH TIME | BOROUGH | ZIP CODE | LATITUDE | LONGITUDE | LOCATION | ON STREET NAME | CROSS STREET NAME | OFF STREET NAME | NUMBER OF PERSONS INJURED | NUMBER OF PERSONS KILLED | NUMBER OF PEDESTRIANS INJURED | NUMBER OF PEDESTRIANS KILLED | NUMBER OF CYCLIST INJURED | NUMBER OF CYCLIST KILLED | NUMBER OF MOTORIST INJURED | NUMBER OF MOTORIST KILLED | CONTRIBUTING FACTOR VEHICLE 1 | CONTRIBUTING FACTOR VEHICLE 2 | CONTRIBUTING FACTOR VEHICLE 3 | CONTRIBUTING FACTOR VEHICLE 4 | CONTRIBUTING FACTOR VEHICLE 5 | COLLISION_ID | VEHICLE TYPE CODE 1 | VEHICLE TYPE CODE 2 | VEHICLE TYPE CODE 3 | VEHICLE TYPE CODE 4 | VEHICLE TYPE CODE 5 | geometry | |
|---|---|---|---|---|---|---|---|---|---|---|---|---|---|---|---|---|---|---|---|---|---|---|---|---|---|---|---|---|---|---|
| 5 | 05/01/2021 | 3:01 | MANHATTAN | 10032.0 | 40.832886 | -73.944020 | (40.832886, -73.94402) | NaN | NaN | 555 WEST 156 STREET | 0 | 0 | 0 | 0 | 0 | 0 | 0 | 0 | Passing Too Closely | Unspecified | NaN | NaN | NaN | 4413557 | Taxi | Station Wagon/Sport Utility Vehicle | NaN | NaN | NaN | POINT (-73.94402 40.83289) |
| 20 | 05/01/2021 | 13:54 | MANHATTAN | 10036.0 | 40.761300 | -73.999435 | (40.7613, -73.999435) | NaN | NaN | 635 WEST 42 STREET | 0 | 0 | 0 | 0 | 0 | 0 | 0 | 0 | Passing Too Closely | Unspecified | NaN | NaN | NaN | 4413013 | Station Wagon/Sport Utility Vehicle | NaN | NaN | NaN | NaN | POINT (-73.99944 40.76130) |
| 22 | 05/01/2021 | 17:55 | MANHATTAN | 10029.0 | 40.799984 | -73.944855 | (40.799984, -73.944855) | EAST 116 STREET | MADISON AVENUE | NaN | 0 | 0 | 0 | 0 | 0 | 0 | 0 | 0 | Passing Too Closely | Unspecified | NaN | NaN | NaN | 4412865 | Sedan | NaN | NaN | NaN | NaN | POINT (-73.94486 40.79998) |
| 34 | 05/01/2021 | 9:45 | MANHATTAN | 10035.0 | 40.802753 | -73.933580 | (40.802753, -73.93358) | EAST 125 STREET | 2 AVENUE | NaN | 0 | 0 | 0 | 0 | 0 | 0 | 0 | 0 | Following Too Closely | Unspecified | NaN | NaN | NaN | 4412859 | Sedan | Box Truck | NaN | NaN | NaN | POINT (-73.93358 40.80275) |
| 46 | 05/02/2021 | 12:15 | MANHATTAN | 10037.0 | 40.810024 | -73.937540 | (40.810024, -73.93754) | NaN | NaN | 2096 MADISON AVENUE | 0 | 0 | 0 | 0 | 0 | 0 | 0 | 0 | Following Too Closely | Unspecified | NaN | NaN | NaN | 4412870 | Sedan | NaN | NaN | NaN | NaN | POINT (-73.93754 40.81002) |
| ... | ... | ... | ... | ... | ... | ... | ... | ... | ... | ... | ... | ... | ... | ... | ... | ... | ... | ... | ... | ... | ... | ... | ... | ... | ... | ... | ... | ... | ... | ... |
| 32333 | 12/30/2023 | 3:04 | MANHATTAN | 10029.0 | 40.790817 | -73.942880 | (40.790817, -73.94288) | NaN | NaN | 231 EAST 106 STREET | 0 | 0 | 0 | 0 | 0 | 0 | 0 | 0 | Passing Too Closely | Unspecified | NaN | NaN | NaN | 4691754 | Station Wagon/Sport Utility Vehicle | Station Wagon/Sport Utility Vehicle | NaN | NaN | NaN | POINT (-73.94288 40.79082) |
| 32340 | 12/30/2023 | 17:40 | MANHATTAN | 10001.0 | 40.747234 | -73.993370 | (40.747234, -73.99337) | WEST 28 STREET | 7 AVENUE | NaN | 1 | 0 | 0 | 0 | 0 | 0 | 1 | 0 | Following Too Closely | Unspecified | NaN | NaN | NaN | 4692517 | Taxi | Box Truck | NaN | NaN | NaN | POINT (-73.99337 40.74723) |
| 32349 | 12/31/2023 | 22:40 | MANHATTAN | 10019.0 | 40.767130 | -73.993730 | (40.76713, -73.99373) | 11 AVENUE | WEST 52 STREET | NaN | 0 | 0 | 0 | 0 | 0 | 0 | 0 | 0 | Following Too Closely | Turning Improperly | NaN | NaN | NaN | 4693643 | Station Wagon/Sport Utility Vehicle | Bus | NaN | NaN | NaN | POINT (-73.99373 40.76713) |
| 32351 | 12/31/2023 | 16:24 | MANHATTAN | 10027.0 | 40.809310 | -73.949120 | (40.80931, -73.94912) | NaN | NaN | 215 WEST 125 STREET | 0 | 0 | 0 | 0 | 0 | 0 | 0 | 0 | Passing Too Closely | Unspecified | NaN | NaN | NaN | 4693991 | Sedan | Sedan | NaN | NaN | NaN | POINT (-73.94912 40.80931) |
| 32359 | 12/31/2023 | 21:16 | MANHATTAN | 10011.0 | 40.738250 | -74.001080 | (40.73825, -74.00108) | NaN | NaN | 237 WEST 13 STREET | 0 | 0 | 0 | 0 | 0 | 0 | 0 | 0 | Passing Too Closely | Unspecified | NaN | NaN | NaN | 4691995 | Station Wagon/Sport Utility Vehicle | NaN | NaN | NaN | NaN | POINT (-74.00108 40.73825) |
2789 rows × 30 columns
Add hour
# Convert 'CRASH TIME' to datetime format if it's not already in datetime
manhattan_crashes_filtered['CRASH TIME'] = pd.to_datetime(manhattan_crashes_filtered['CRASH TIME'], format='%H:%M')
# Extract the hour from 'CRASH TIME' and create a new column called 'CRASH HOUR'
manhattan_crashes_filtered['CRASH HOUR'] = manhattan_crashes_filtered['CRASH TIME'].dt.hour
manhattan_crashes_filteredC:\Users\txx11\mambaforge\envs\musa-550-fall-2023\lib\site-packages\geopandas\geodataframe.py:1538: SettingWithCopyWarning:
A value is trying to be set on a copy of a slice from a DataFrame.
Try using .loc[row_indexer,col_indexer] = value instead
See the caveats in the documentation: https://pandas.pydata.org/pandas-docs/stable/user_guide/indexing.html#returning-a-view-versus-a-copy
super().__setitem__(key, value)
C:\Users\txx11\mambaforge\envs\musa-550-fall-2023\lib\site-packages\geopandas\geodataframe.py:1538: SettingWithCopyWarning:
A value is trying to be set on a copy of a slice from a DataFrame.
Try using .loc[row_indexer,col_indexer] = value instead
See the caveats in the documentation: https://pandas.pydata.org/pandas-docs/stable/user_guide/indexing.html#returning-a-view-versus-a-copy
super().__setitem__(key, value)| CRASH DATE | CRASH TIME | BOROUGH | ZIP CODE | LATITUDE | LONGITUDE | LOCATION | ON STREET NAME | CROSS STREET NAME | OFF STREET NAME | NUMBER OF PERSONS INJURED | NUMBER OF PERSONS KILLED | NUMBER OF PEDESTRIANS INJURED | NUMBER OF PEDESTRIANS KILLED | NUMBER OF CYCLIST INJURED | NUMBER OF CYCLIST KILLED | NUMBER OF MOTORIST INJURED | NUMBER OF MOTORIST KILLED | CONTRIBUTING FACTOR VEHICLE 1 | CONTRIBUTING FACTOR VEHICLE 2 | CONTRIBUTING FACTOR VEHICLE 3 | CONTRIBUTING FACTOR VEHICLE 4 | CONTRIBUTING FACTOR VEHICLE 5 | COLLISION_ID | VEHICLE TYPE CODE 1 | VEHICLE TYPE CODE 2 | VEHICLE TYPE CODE 3 | VEHICLE TYPE CODE 4 | VEHICLE TYPE CODE 5 | geometry | CRASH HOUR | |
|---|---|---|---|---|---|---|---|---|---|---|---|---|---|---|---|---|---|---|---|---|---|---|---|---|---|---|---|---|---|---|---|
| 5 | 05/01/2021 | 1900-01-01 03:01:00 | MANHATTAN | 10032.0 | 40.832886 | -73.944020 | (40.832886, -73.94402) | NaN | NaN | 555 WEST 156 STREET | 0 | 0 | 0 | 0 | 0 | 0 | 0 | 0 | Passing Too Closely | Unspecified | NaN | NaN | NaN | 4413557 | Taxi | Station Wagon/Sport Utility Vehicle | NaN | NaN | NaN | POINT (-73.94402 40.83289) | 3 |
| 20 | 05/01/2021 | 1900-01-01 13:54:00 | MANHATTAN | 10036.0 | 40.761300 | -73.999435 | (40.7613, -73.999435) | NaN | NaN | 635 WEST 42 STREET | 0 | 0 | 0 | 0 | 0 | 0 | 0 | 0 | Passing Too Closely | Unspecified | NaN | NaN | NaN | 4413013 | Station Wagon/Sport Utility Vehicle | NaN | NaN | NaN | NaN | POINT (-73.99944 40.76130) | 13 |
| 22 | 05/01/2021 | 1900-01-01 17:55:00 | MANHATTAN | 10029.0 | 40.799984 | -73.944855 | (40.799984, -73.944855) | EAST 116 STREET | MADISON AVENUE | NaN | 0 | 0 | 0 | 0 | 0 | 0 | 0 | 0 | Passing Too Closely | Unspecified | NaN | NaN | NaN | 4412865 | Sedan | NaN | NaN | NaN | NaN | POINT (-73.94486 40.79998) | 17 |
| 34 | 05/01/2021 | 1900-01-01 09:45:00 | MANHATTAN | 10035.0 | 40.802753 | -73.933580 | (40.802753, -73.93358) | EAST 125 STREET | 2 AVENUE | NaN | 0 | 0 | 0 | 0 | 0 | 0 | 0 | 0 | Following Too Closely | Unspecified | NaN | NaN | NaN | 4412859 | Sedan | Box Truck | NaN | NaN | NaN | POINT (-73.93358 40.80275) | 9 |
| 46 | 05/02/2021 | 1900-01-01 12:15:00 | MANHATTAN | 10037.0 | 40.810024 | -73.937540 | (40.810024, -73.93754) | NaN | NaN | 2096 MADISON AVENUE | 0 | 0 | 0 | 0 | 0 | 0 | 0 | 0 | Following Too Closely | Unspecified | NaN | NaN | NaN | 4412870 | Sedan | NaN | NaN | NaN | NaN | POINT (-73.93754 40.81002) | 12 |
| ... | ... | ... | ... | ... | ... | ... | ... | ... | ... | ... | ... | ... | ... | ... | ... | ... | ... | ... | ... | ... | ... | ... | ... | ... | ... | ... | ... | ... | ... | ... | ... |
| 32333 | 12/30/2023 | 1900-01-01 03:04:00 | MANHATTAN | 10029.0 | 40.790817 | -73.942880 | (40.790817, -73.94288) | NaN | NaN | 231 EAST 106 STREET | 0 | 0 | 0 | 0 | 0 | 0 | 0 | 0 | Passing Too Closely | Unspecified | NaN | NaN | NaN | 4691754 | Station Wagon/Sport Utility Vehicle | Station Wagon/Sport Utility Vehicle | NaN | NaN | NaN | POINT (-73.94288 40.79082) | 3 |
| 32340 | 12/30/2023 | 1900-01-01 17:40:00 | MANHATTAN | 10001.0 | 40.747234 | -73.993370 | (40.747234, -73.99337) | WEST 28 STREET | 7 AVENUE | NaN | 1 | 0 | 0 | 0 | 0 | 0 | 1 | 0 | Following Too Closely | Unspecified | NaN | NaN | NaN | 4692517 | Taxi | Box Truck | NaN | NaN | NaN | POINT (-73.99337 40.74723) | 17 |
| 32349 | 12/31/2023 | 1900-01-01 22:40:00 | MANHATTAN | 10019.0 | 40.767130 | -73.993730 | (40.76713, -73.99373) | 11 AVENUE | WEST 52 STREET | NaN | 0 | 0 | 0 | 0 | 0 | 0 | 0 | 0 | Following Too Closely | Turning Improperly | NaN | NaN | NaN | 4693643 | Station Wagon/Sport Utility Vehicle | Bus | NaN | NaN | NaN | POINT (-73.99373 40.76713) | 22 |
| 32351 | 12/31/2023 | 1900-01-01 16:24:00 | MANHATTAN | 10027.0 | 40.809310 | -73.949120 | (40.80931, -73.94912) | NaN | NaN | 215 WEST 125 STREET | 0 | 0 | 0 | 0 | 0 | 0 | 0 | 0 | Passing Too Closely | Unspecified | NaN | NaN | NaN | 4693991 | Sedan | Sedan | NaN | NaN | NaN | POINT (-73.94912 40.80931) | 16 |
| 32359 | 12/31/2023 | 1900-01-01 21:16:00 | MANHATTAN | 10011.0 | 40.738250 | -74.001080 | (40.73825, -74.00108) | NaN | NaN | 237 WEST 13 STREET | 0 | 0 | 0 | 0 | 0 | 0 | 0 | 0 | Passing Too Closely | Unspecified | NaN | NaN | NaN | 4691995 | Station Wagon/Sport Utility Vehicle | NaN | NaN | NaN | NaN | POINT (-74.00108 40.73825) | 21 |
2789 rows × 31 columns
To visualize them, we used the cluster concentration plot to visualize the cluster of these crashes. In the map below, there is also a high concentration of such crashes in lower east near Chinatown and SOHO, and midtown west near Time Square and Lincoln Tunnel. Through such information, we assume these areas in Manhattan may experience higher congestions than others due to large number of crashes caused by following or passing too closely.
import folium
from folium.plugins import FastMarkerCluster# Ensure the data contains valid longitude and latitude values
manhattan_crashes_filtered = manhattan_crashes_filtered.dropna(subset=['LONGITUDE', 'LATITUDE'])
# Create a base map centered around Manhattan
m = folium.Map(location=[40.7580, -73.9851], zoom_start=12, tiles='CartoDB dark_matter')
# Add crash points to the map using FastMarkerCluster
FastMarkerCluster(data=manhattan_crashes_filtered[['LATITUDE', 'LONGITUDE']].values.tolist()).add_to(m)
mMake this Notebook Trusted to load map: File -> Trust Notebook
Conclusion
The purpose of this project is to design a predictive model for traffic congestion using a set of environmental and contextual features, including temperature, precipitation, wind speed, the occurrence of events, and whether it is a weekend. Traffic congestion is a significant issue in urban areas, impacting commute times, air quality, and overall productivity. By leveraging these variables, the model aims to understand the factors influencing traffic patterns and provide accurate predictions of traffic counts. Such a model could be instrumental in improving traffic management systems, informing infrastructure planning, and helping commuters make more informed decisions. The project seeks to demonstrate the feasibility of using readily available data to address real-world urban challenges.
A traffic prediction model has significant potential applications in optimizing traffic light systems to improve traffic flow and reduce congestion. By accurately predicting traffic counts based on environmental factors, events, and time-related variables, the model could serve as a critical input for adaptive traffic light control systems. For instance, the model could help dynamically adjust traffic light timings based on anticipated traffic volumes at specific intersections. During periods of high predicted traffic, longer green light durations could be allocated to heavily congested routes, while during low-traffic periods, shorter cycles could minimize unnecessary delays. This would ensure a more efficient allocation of green time, reducing wait times, fuel consumption, and emissions caused by idling vehicles.
Additionally, the model could be integrated into intelligent traffic management systems that coordinate traffic lights across multiple intersections. By predicting traffic patterns in advance, the system could optimize signal synchronization to create “green waves,” allowing vehicles to travel through a series of intersections without stopping. This approach could be particularly useful in urban areas with high traffic density, where poor signal coordination often exacerbates congestion. Furthermore, during special events or adverse weather conditions, the model could help traffic authorities proactively adjust signal timings to handle anticipated surges in traffic, minimizing disruptions. Overall, the integration of traffic prediction models into traffic light optimization systems has the potential to enhance urban mobility, reduce congestion, and improve the overall efficiency of transportation networks.